

Background
The City of Boca Raton's water and wastewater operation serves a population of 86,000 along Florida's Atlantic coast. The system spans a 17.5 MGD wastewater treatment plant, a 30 MGD lime softening plant, a 40 MGD nanofiltration plant, and 240 lift stations; all running as a 100% water-reuse system.
The mandate is to meet treatment demand while minimizing environmental impact. That means every process variable matters, and every operator across operations, instrumentation, and engineering needs a shared view of what the plant is actually doing in real time and historically.
Challenge
By 2011, Boca Raton's utilities had grown to more than 22,000 tags across the operation, all controlled via the GE Proficy iFIX SCADA platform. The problem: the classic iFIX historian carried a hard ceiling of 2,500 tags.
That left more than 19,500 tags with no path to collection, storage, or historical trending. Operators couldn't compare current conditions against past events. Instrumentation teams couldn't troubleshoot anomalies over time. Engineers running energy and chemical studies had to work from incomplete datasets or pay consultants to fill in the gaps.
The shortfall, summarized:
-
iFIX historian capped at 2,500 tags
-
19,500+ tags with no historical record
-
No cross-team process data visibility
-
Energy and chemical costs made it it harder to optimize
-
Consultants needed for advanced analysis
Solution
In 2011, Boca Raton deployed the Canary data historian alongside the existing GE Proficy iFIX SCADA platform. This gave every tag a path to collection and storage, with no cap on scale. The historian integrated directly into the city's HMI software with prebuilt trends, and personnel across operations, engineering, and administration gained instant access to real-time and historical data for any point in the facility.
"Canary software is very easy to use and very intuitive — we use it all the way from operations to administration."
- Mike Tufts, Control & SCADA Supervisor
The annotation system became a cornerstone of daily operations. Operators log lab results, hourly walkthroughs, and process changes as annotations that appear directly on the trend line at the exact moment they occurred — closing the communication gap between shifts and departments.
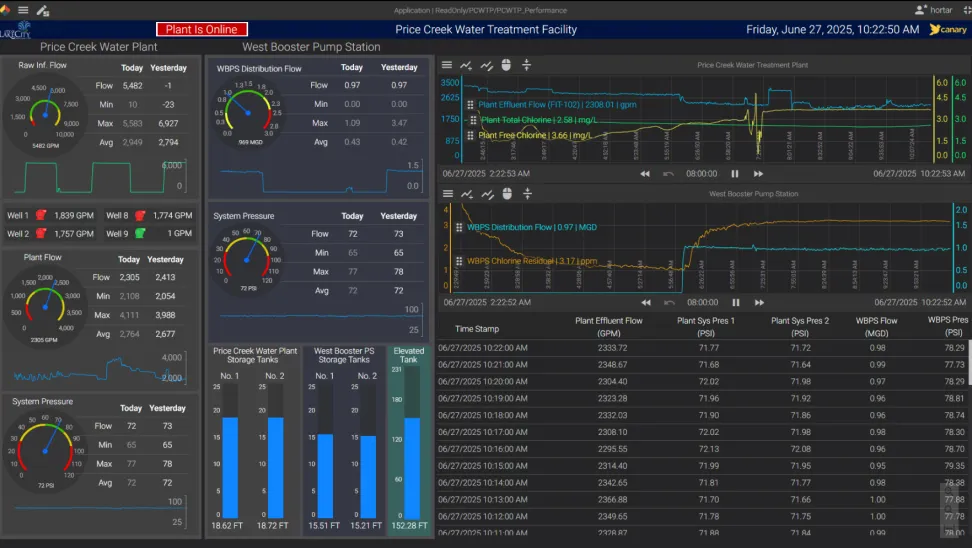
"They can go back and compare today's events to historical events and see if anything in the process is operating differently — like higher or lower flows."
- Mike Tufts, Control & SCADA Supervisor
Results
More than a decade later, the same architecture deployed in 2011 is still running at 1-second collection intervals across all 22,000+ tags, with zero database issues. The team is only now archiving the first ten years of data, not because the system required it, but by choice.
-
Full tag coverage. All 22,000+ tags that were previously uncollectable under the iFIX historian all have complete real-time and historical records.
-
Faster troubleshooting. Instrumentation teams trace anomalies to their origin instantly, separating true instrument failures from upstream process issues.
-
Energy cost reduction. Flow and performance data on the membrane skids drives continuous adjustments. With annual power bills in the millions, incremental gains compound quickly.
-
Tighter chemical budgeting. Every chemical draw is tied to production volume and flow data, enabling more accurate forecasting month-over-month and contract-to-contract.
New users typically reach productive use of the Canary system in under ten minutes. Creating a learning curve flat enough that admin staff use the same trends and dashboards as the SCADA team.